
Website speed is defined as the time a browser takes to fully load and display a web page to a visitor. For Australian website owners and digital marketers, slow loading is not a minor inconvenience. It directly costs you rankings, conversions, and credibility. Google's 2026 Core Web Vitals thresholds set the bar at LCP under 2.5 seconds, INP under 200ms, and CLS under 0.1 for a site to be considered "good." These three metrics, Largest Contentful Paint, Interaction to Next Paint, and Cumulative Layout Shift, are the industry-standard measures of page experience. If you want to improve website speed and hold your Google rankings, these numbers are your targets.
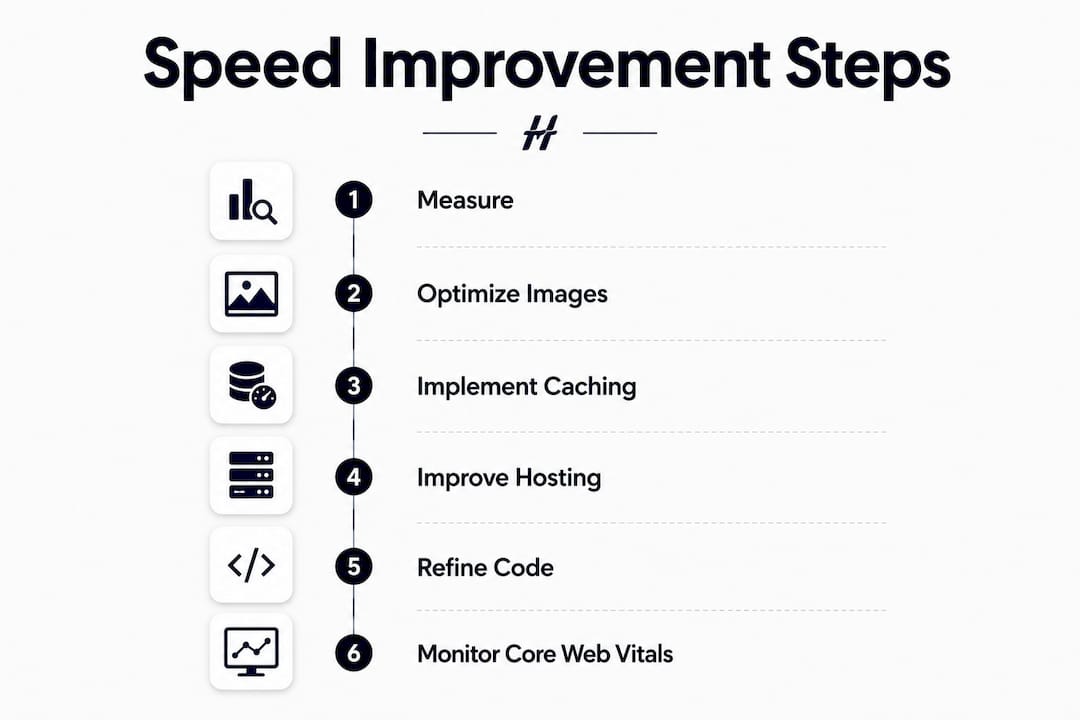
What tools do you need to measure your website speed?
You cannot fix what you have not measured. Start with Google PageSpeed Insights, which scores your site against Core Web Vitals using real-world Chrome User Experience Report (CrUX) data. Lighthouse, built into Chrome DevTools, gives you a lab-based audit with specific recommendations. GTmetrix adds waterfall charts that show exactly which resources are slowing your page down.
Three baseline metrics matter most before you touch any code:
- Load time: The total time for the page to become fully interactive.
- Time to First Byte (TTFB): How long the server takes to respond. Managed WordPress hosting achieves TTFB of 50–200ms; legacy shared hosting often sits at 400–800ms.
- Page size: Total weight of all assets. Bloated pages are the most common cause of slow load times.
Use Chrome DevTools Network tab to identify the heaviest assets on any given page. Filter by file type to spot oversized images, unminified scripts, or third-party requests that load before your content.
Pro Tip: Run PageSpeed Insights on your three most-visited pages, not just your homepage. Product pages and blog posts often carry far more weight and score worse.
How to achieve the biggest speed gains with image optimisation, caching, and hosting
These fixes deliver the highest return for the least effort. Start here before touching JavaScript or CSS.

Image optimisation
Image compression alone can reduce page weight by 40–60%, improving load times by 1–3 seconds. That is the single largest gain available to most sites. Convert images to WebP or AVIF formats, which offer far better compression than JPEG or PNG at equivalent visual quality. Always set explicit width and height attributes on every image element. This prevents layout shifts and protects your CLS score.
Compression and caching
- Enable Brotli compression. Brotli reduces text file sizes by 60–90%, making it 15–20% more efficient than GZIP. Most modern hosting environments support it with a single configuration change.
- Set browser caching headers. Static assets like images, fonts, and CSS files should be cached for at least 30 days. Returning visitors load your site from their local cache rather than your server.
- Enable full-page server-side caching. Server-side caching can reduce TTFB from 800ms to under 100ms by serving pre-rendered HTML without hitting the database. For WordPress sites, this is the single highest-impact change you can make.
Hosting and CDN
Hosting quality is the biggest variable impacting TTFB. Even the best front-end optimisations cannot fully compensate for poor server infrastructure. Upgrading from shared hosting to a managed hosting environment drops TTFB from 400–800ms to under 300ms, which directly improves every Core Web Vitals metric.
A Content Delivery Network (CDN) stores copies of your static assets on servers around the world. Australian visitors loading a site hosted in Sydney will receive assets from a nearby CDN node rather than a distant origin server. This cuts latency on every page load, regardless of the visitor's location.
Pro Tip: If your TTFB is above 600ms, fix your hosting first. No amount of image compression or code minification will overcome a slow server response.
What advanced tactics can further speed up your site?
Once critical fixes are in place, the next layer of gains comes from how your browser loads and executes code.
- Minify CSS, JavaScript, and HTML. Removing whitespace, comments, and redundant characters from code files reduces their size without changing functionality. Most build tools and caching plugins handle this automatically.
- Defer and async-load JavaScript. Large JS bundles and long main thread tasks cause poor INP scores. Adding
deferorasyncattributes to non-critical scripts prevents them from blocking the browser's rendering process. - Audit third-party scripts. Chat widgets, ad trackers, and social media embeds are major sources of performance regressions. Load them after the main content has rendered, or remove those you no longer actively use.
- Lazy load below-the-fold images and videos. Lazy loading saves bandwidth and load time on content-heavy pages by deferring off-screen assets until the visitor scrolls toward them. Never apply lazy loading to above-the-fold images, as this delays your LCP element.
- Limit preload hints. Overusing preload resource hints creates bandwidth competition between assets. Restrict preloading to one or two critical resources: your hero image and your primary font.
Pro Tip: Use the Coverage tab in Chrome DevTools to find unused CSS and JavaScript. Removing dead code is one of the fastest ways to reduce your total blocking time.
How do you diagnose and fix Core Web Vitals issues?
Core Web Vitals are Google's official user experience metrics. Fixing them directly improves both your search rankings and how visitors feel using your site.
Fixing LCP (Largest Contentful Paint)
- Identify your LCP element using PageSpeed Insights or Lighthouse. It is usually a hero image or a large heading.
- Serve LCP images as WebP or AVIF with explicit dimensions set. This reduces file size and prevents layout shift simultaneously.
- Add
fetchpriority="high"to your LCP image tag. This tells the browser to load it before other assets, which measurably improves LCP scores. - Host your LCP image on your own domain or CDN. Loading it from a third-party server adds DNS lookup time.
Fixing INP (Interaction to Next Paint)
INP measures how quickly your page responds to clicks, taps, and keyboard input. Poor INP almost always traces back to JavaScript. Break large JS tasks into smaller chunks so the main thread stays free to handle user input. Use async and defer on all non-critical scripts, and delay third-party script loads until after the page is interactive.
Fixing CLS (Cumulative Layout Shift)
| CLS cause | Fix |
|---|---|
| Images without dimensions | Add explicit width and height to every image element |
| Web fonts causing text reflow | Use font-display: swap and preload your primary font |
| Dynamically injected content | Reserve space with CSS min-height before content loads |
| Late-loading ads or embeds | Set fixed container dimensions for all ad slots |
Track your Core Web Vitals over time using Google Search Console's Core Web Vitals report. It shows real-user data segmented by page group, so you can prioritise the pages that affect the most visitors.
Key takeaways
Fast-loading websites require a layered approach: fix hosting and images first, then refine code delivery and Core Web Vitals to hold and improve your Google rankings.
| Point | Details |
|---|---|
| Measure before you fix | Use PageSpeed Insights, Lighthouse, and GTmetrix to identify your actual bottlenecks. |
| Images and hosting first | Image compression and hosting upgrades deliver the largest speed gains for most sites. |
| Brotli over GZIP | Brotli compression is 15–20% more efficient and should be enabled on any modern server. |
| Defer and audit scripts | Async-load non-critical JS and remove unused third-party scripts to protect INP scores. |
| Monitor Core Web Vitals | Track LCP, INP, and CLS in Google Search Console to catch regressions before they affect rankings. |
Speed is never a one-time fix
I have worked on enough websites to know that speed optimisation is iterative. You fix the obvious issues, your scores improve, and then six months later a new plugin, a new font, or a new marketing script has quietly added 400ms back onto your load time. The sites that stay fast are the ones with owners who check their scores regularly, not just after a redesign.
The most underestimated factor I see is hosting. Website owners spend hours tweaking image sizes and minifying CSS while sitting on a $5-a-month shared server with a 700ms TTFB. No front-end fix closes that gap. Upgrading to managed hosting is often the single decision that moves a site from "poor" to "good" in PageSpeed Insights overnight.
Third-party scripts are the other silent killer. Every chat widget, heatmap tool, and social pixel you add to your site loads its own JavaScript on every page. Most of them are never audited after installation. I recommend a quarterly script audit: open your Network tab, filter by third-party domains, and ask whether each one is still earning its place on the page.
The sites I have seen perform best long-term are built with speed as a design constraint from day one, not bolted on afterwards. That means choosing a fast theme, a quality host, and keeping the plugin count low. Retrofitting speed onto a bloated site is always harder than building it right the first time.
— Hasanoff
How Hasanoffcreative builds fast websites from the ground up
Speed is not an afterthought at Hasanoffcreative. Every website the studio builds is engineered for fast page loading, clean code, and Core Web Vitals compliance from the first line of design. Whether you need a custom website, a full redesign, or an eCommerce build, the team brings technical performance expertise to every project.

Clients like Lumi Studio and Astra Dining have seen measurable increases in enquiries and brand presence after working with Hasanoffcreative. If your current site is losing visitors to slow load times, a professionally built, high-performance website is the most direct path to better rankings and more conversions.
FAQ
What is a good website load time in 2026?
Google's Core Web Vitals standard sets LCP under 2.5 seconds as "good." Aim for a total load time under 3 seconds to retain most visitors.
How does hosting affect website speed?
Hosting directly controls your TTFB. Managed hosting achieves TTFB of 50–200ms, while shared hosting often sits at 400–800ms, which no front-end fix can fully overcome.
What is the fastest way to reduce page weight?
Image compression is the fastest single fix. It can reduce total page weight by 40–60% and cut load times by 1–3 seconds on most sites.
Does JavaScript slow down a website?
Large JavaScript bundles block the browser's rendering process and cause poor INP scores. Deferring non-critical scripts and removing unused third-party code resolves most JS-related slowdowns.
How often should I check my website speed?
Check your Core Web Vitals in Google Search Console at least once a month. Any new plugin, script, or design change can introduce regressions that are far easier to fix early.